Macro Strategist Report — Indian Equities (Nifty50)
Date: August 03, 2026
2. Executive Summary
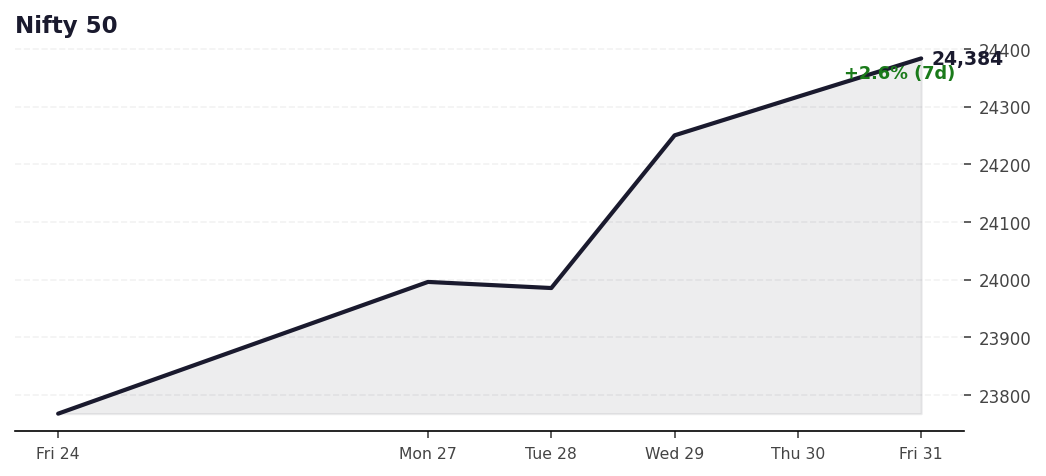
Regime: STABLE — the gate missed by 3.8 points. Nifty50 closed 03-Aug at 24,774.30, up 1.60% on the day and finishing at the high of the session. Its 200-day sits at 24,778.10. The index closed 0.015% — three and eight-tenths points — below the line that reactivates the scan. It is 3.54% above its 50-day (23,926.27). It has not been this close in nine months.
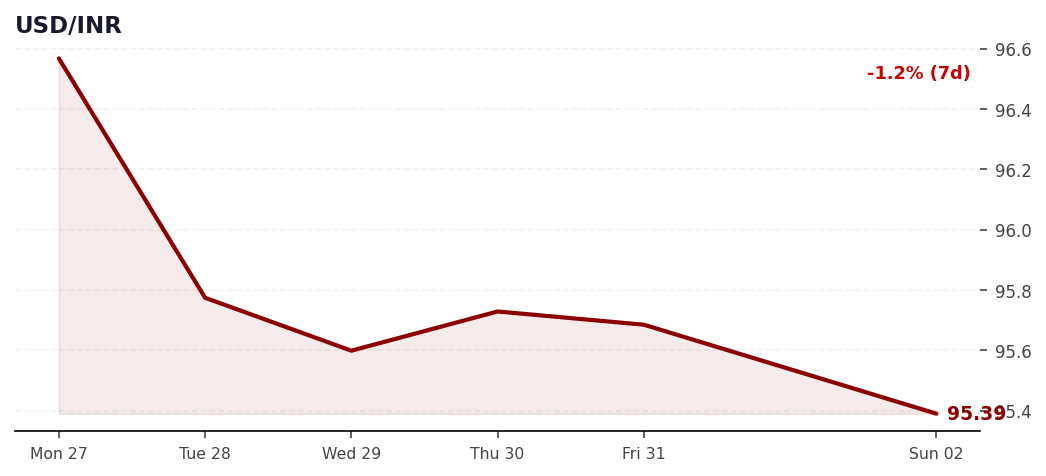
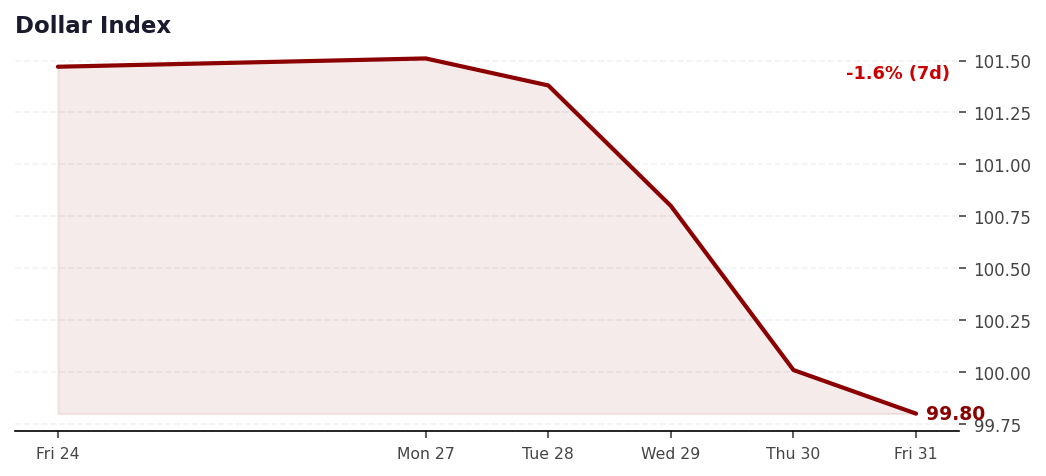
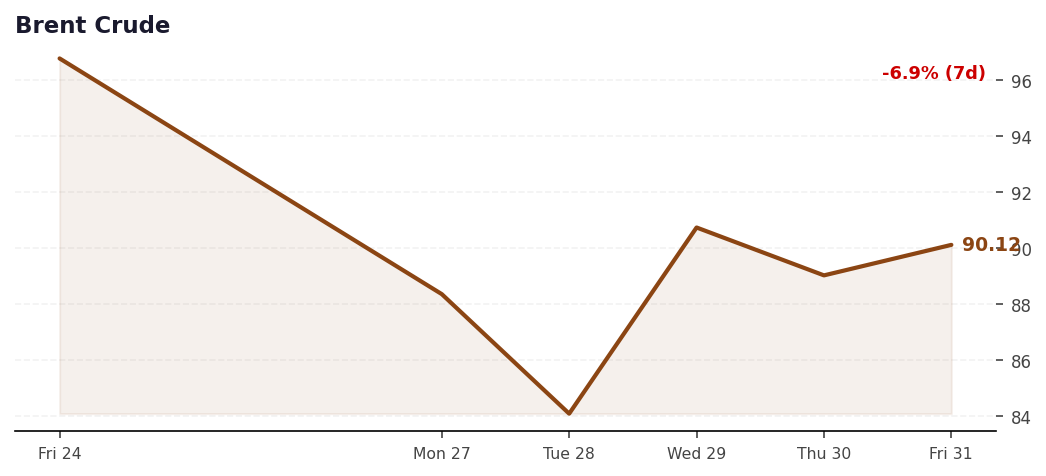
Dominant driver: a broad risk-ON impulse with no domestic author. Brent -6.9% in seven days, the dollar -1.8% to 99.69, VIX -13.9% to 15.99, and the rupee firmer at 95.24 (from 95.68 on Thursday). Nothing in today's India feed explains a 1.6% index move — the bid is imported, and imported bids reverse on one dollar-positive print. The catch: Brent is still exactly $90.12, on the CAD-stress line, not through it.
Money Maker scan ran (STABLE regime) and returned zero signals — for the second session running. Fifteen Nifty500 names fired a clean V3 shaved-bottom candle in the last ten sessions, ASHOKLEY and HYUNDAI as recently as Friday. Every one was rejected by the index SMA200 gate. That is the filter working, not failing.
The rally came on no volume, and that is the real story. Four Grade-A watchlist names reclaimed their own 200-day on today's close — BHARTIHEXA (+2.13% over it), JKCEMENT (+0.51%), INDIANB (+0.14%) and URBANCO — but they did it on 0.24x to 0.53x of their 100-day average volume. The strategy demands 1.5x. Institutions did not turn up for this move. Not one name printed a valid signal candle, so even with the gate open there would have been nothing to buy.
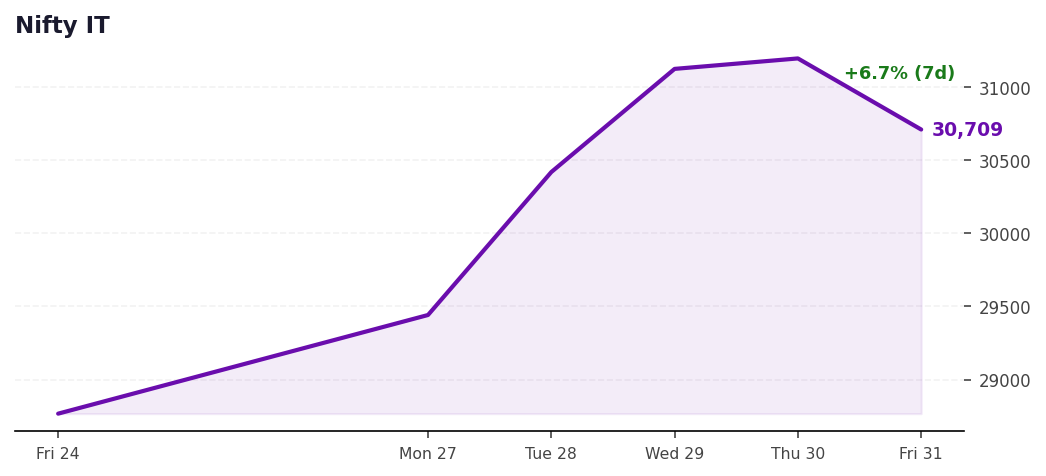
Sector leadership has rotated and the last report missed it. Nifty Auto (+7.40% vs SMA50, +6.90% vs SMA200) and Nifty Consumer (+8.13% / +8.66%) are above both averages and were wrongly reported as having no data. IT remains the trap: +10.89% over its 50-day but still -3.21% under its 200-day.
2b. 7-Day Continuity Tracker
Date
Regime
Nifty Close
Top Conviction
ALERT
02-08-2026
STABLE
24,383.60
BHARTIHEXA, CDSL, JKCEMENT
Close above 24,779 (SMA200) opens the gate — not triggered,
gap narrowed 1.60% → 0.72%
01-08-2026
No report (Saturday)
31-07-2026
No report
30-07-2026
No report
29-07-2026
No report
28-07-2026
No report
27-07-2026
No report
What changed:Yesterday's ALERT did not trigger — it missed by 3.8 points. The 02-Aug report set one condition: Nifty50 closing above its 200-day. Friday's close was 395.9 points short. Today the index closed at 24,774.30 against a 200-day of 24,778.10 — 0.015% short, and it closed at the high of the day, which means it was still being bought into the bell. The call was right in direction and is still technically unconfirmed. The rule takes no partial credit: the gate is closed, the scan stays gated, and the regime remains STABLE for a second session. What genuinely changed is underneath the index. Four staged names — BHARTIHEXA, JKCEMENT, INDIANB and URBANCO — closed above their own 200-day reclaim levels. That sounds like the setup arriving, and it is not, because every one did it on below-average volume: 0.36x, 0.49x, 0.53x and, in URBANCO's case, a 12x news spike that carried it 12.34% beyond its 200-day and straight out of the 5% entry band. A reclaim on half the normal volume is the profile that fails. CDSL, staged yesterday, actually fell 0.81% and is now 2.80% below its line. One correction to yesterday's report: it recorded Nifty Auto, Infra, Finance and Consumer as having no data. They do, and Auto and Consumer are the two strongest sectors in the market. Fixed in Section 7.
3. Market Regime & Scan Decision Rationale
Indicator
Value
Signal
Nifty50 Close
24,774.30
as of 03-08-2026
SMA50
23,926.27
Close above (+3.54%)
SMA200
24,778.10
Close below (-0.02%)
SMA50 vs SMA200
23,926.27 vs 24,778.10
SMA50 below SMA200
Regime
STABLE
Mixed — Money Maker scan gated ON
Distance to gate
3.80 pts
-0.015% — gate CLOSED (Friday's gap was -1.60%)
Nifty50 closed at 24,774.30 on 03 August 2026, up 1.60% and at the high of the session. The 50-day sits at 23,926.27 and the 200-day at 24,778.10. Applying the A2 rule without override: Close > SMA50 is TRUE, Close > SMA200 is FALSE by 3.80 points, and SMA50 > SMA200 is FALSE. That is neither the full BULL set nor the full BEAR set, so the regime is STABLE — and it is worth being precise about how narrowly. The index finished 0.015% below the line. Round the close to the nearest ten points and it reads as a reclaim; the rule does not round. Per the gating rule, STABLE routes to the Money Maker scan (scan/india.py), which is the scan that ran; the bear-market screener was not run. Why the margin is not a technicality: the V4/V5 market filter exists because the backtests show that taking these signals below the 200-day is where the strategy gives back its gains. Three points is as good as three hundred to a rule that reads a boolean. The discipline is the edge — and on the evidence of today's volume (see Section 9), the index being 3.8 points shy may be the least of the reasons not to act.
Key Macro Takeaway: Read this table for what is absent. Crude is down 6.9% on the week, the dollar 1.8%, VIX 13.9%, and the rupee has firmed from 95.68 to 95.24 — but not one item in the India feed accounts for any of it, and the feed carries no single global catalyst either. That matters: a 1.6% index move with no domestic author is an imported bid, and imported bids leave the way they came. Underneath it, the domestic tape is froth: eight of the fifteen India headlines are IPO and GMP chatter, and two of Monday's SME listings already broke issue (one at a 20% discount, one straight to lower circuit). Read that pair together and the message is a market with genuine macro relief at the index level and indiscriminate speculation at the tail. The second item worth your attention is the yen: Japan is intervening with explicit US Treasury support. Coordinated FX intervention is not a routine event, and if it forces a broader dollar repricing the EM tailwind gets larger than anything in today's India news.
Discarded as older than 48h: India 0, Global 0,
US 10 (entire WSJ feed).
5. Indian Market Charts — Last 7 Calendar Days
Nifty 50 · 24,774 · +3.24%
USD/INR · 95.33 · -1.28%
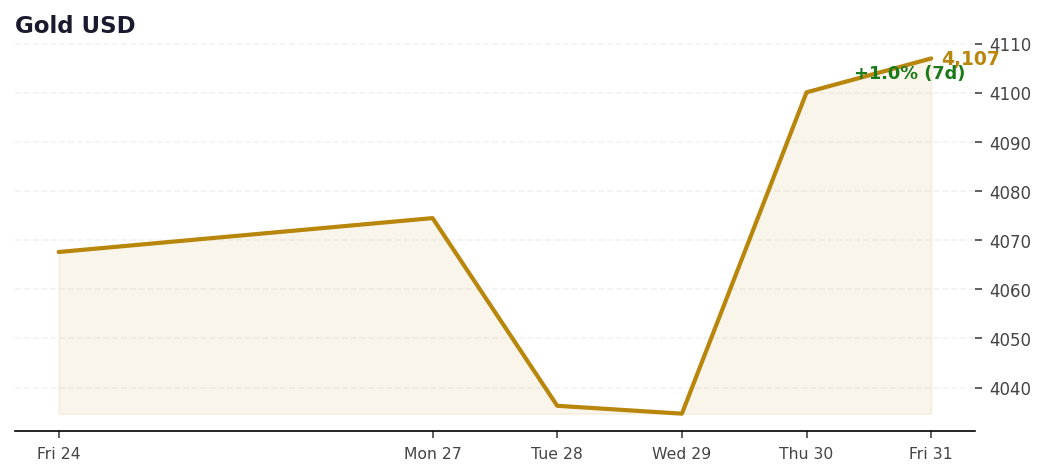
Gold USD · 4,092 · +0.43%
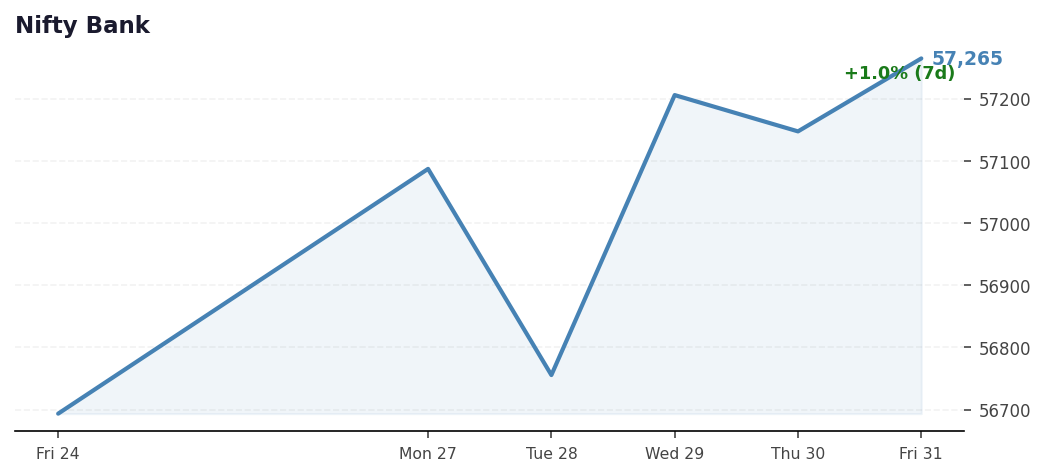
Nifty Bank · 58,248 · +2.03%
Nifty IT · 31,715 · +7.72%
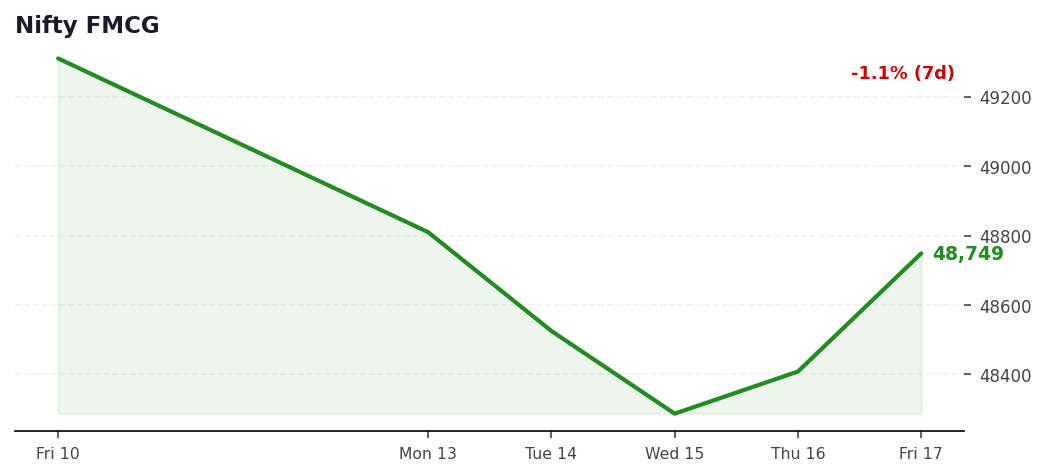
Nifty FMCG · 49,966 · +1.72%
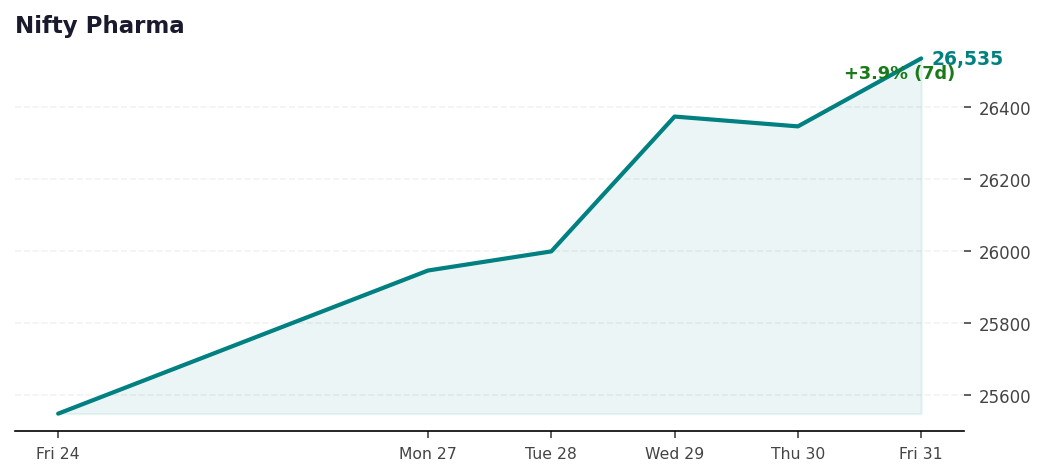
Nifty Pharma · 26,663 · +2.76%
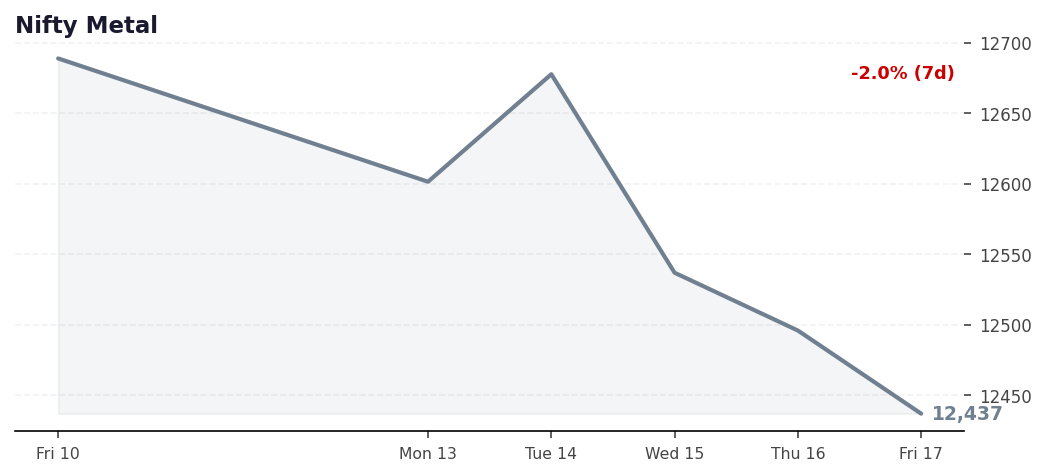
Nifty Metal · 12,915 · +1.54%
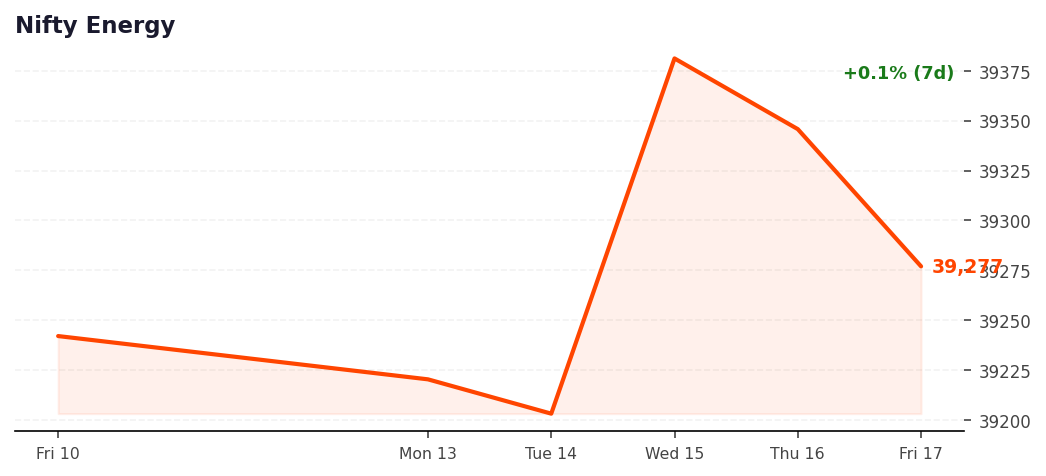
Nifty Energy · 38,937 · +0.54%
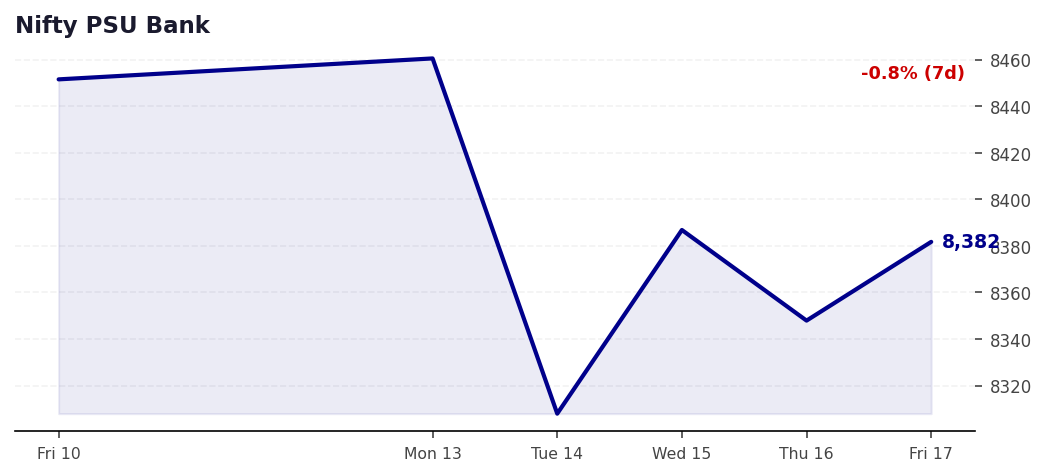
Nifty PSU Bank · 8,487 · +1.43%
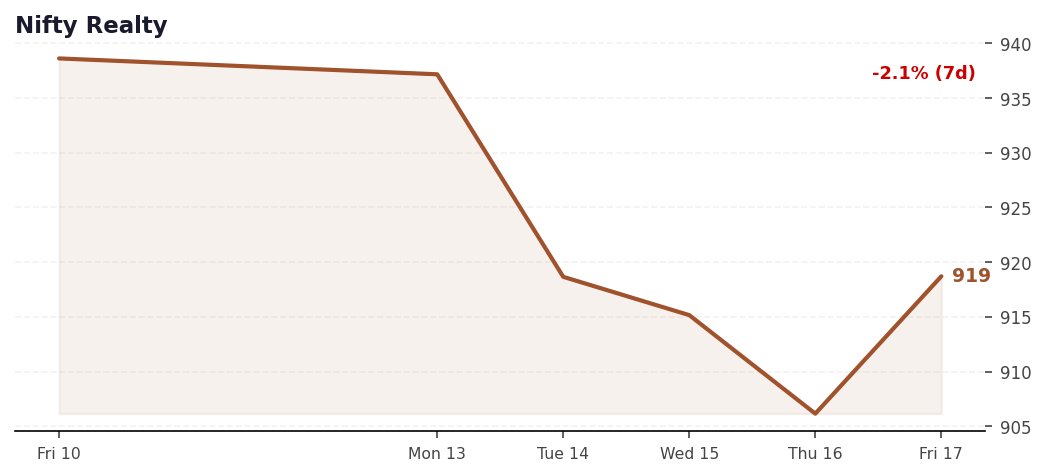
Nifty Realty · 913 · +1.29%
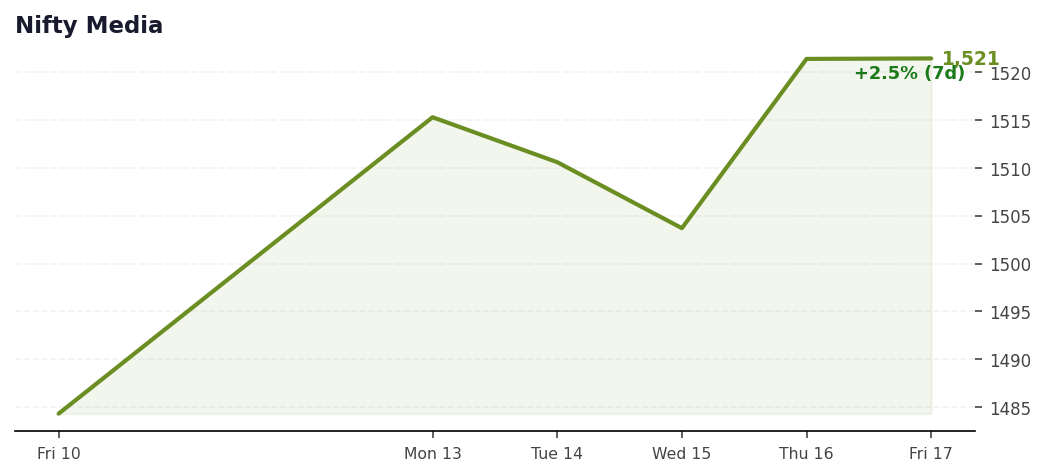
Nifty Media · 1,569 · -3.09%
Data gap — read these charts with care. The mid-July yfinance outage has now backfilled, but it left a hole between 20-Jul and 30-Jul in six sector series: Nifty Media (2 prints), Nifty Energy (2 prints), Nifty PSU Bank (2 prints), Nifty FMCG (2 prints), Nifty Metal (2 prints), Nifty Realty (2 prints) — each has only two prints inside the last fortnight. Their 7-day charts are therefore two-point lines rather than trends, and their 5-day change is shown as gap rather than a number that would silently span three weeks. The moving averages in the table are computed on the full history and remain sound; the short-window figures are the ones to distrust.
Data basis — settled closes throughout. Every index figure in this report is the confirmed 03-Aug close. An earlier build used an unsettled midday snapshot (Nifty 24,600.55) because the index downloader will not re-fetch a date it already holds a partial bar for; those rows were stripped and re-downloaded, and the true close is 24,774.30. The stock CSVs still end at 31-Jul, so the 03-Aug stock bars in Section 11 were pulled from the daily feed and the V3 signal test re-run on each. The regime rule and the Money Maker scan both operate on closes only, never intraday.
6. Global Macro Dashboard — Last 7 Calendar Days
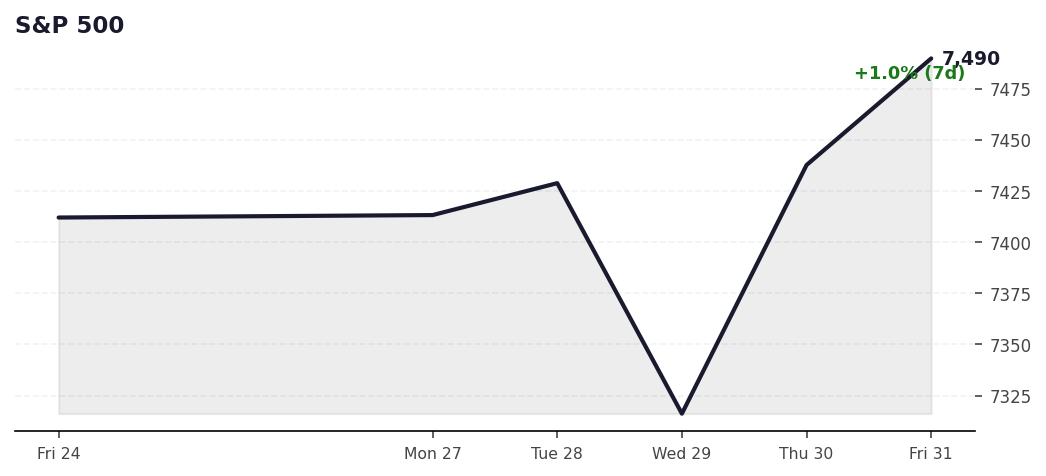
S&P 500 · 7,490 · +1.05%
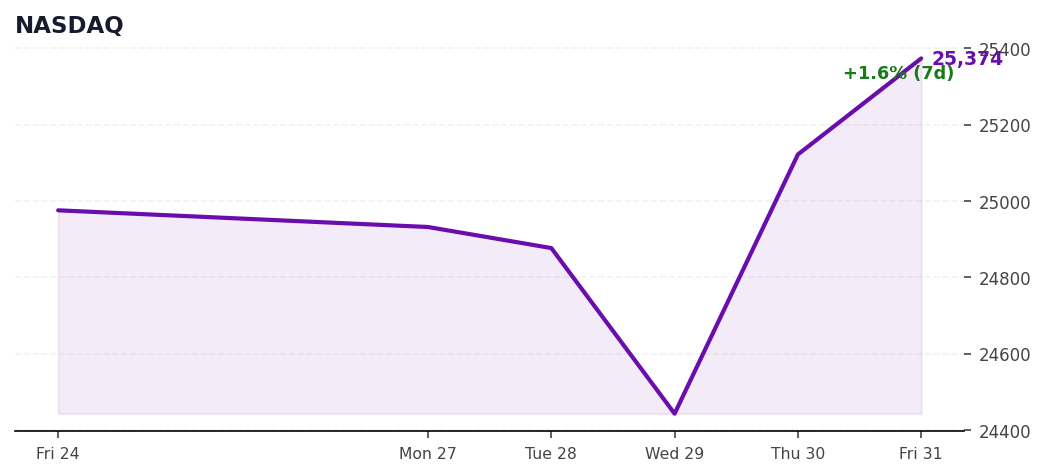
NASDAQ · 25,374 · +1.59%
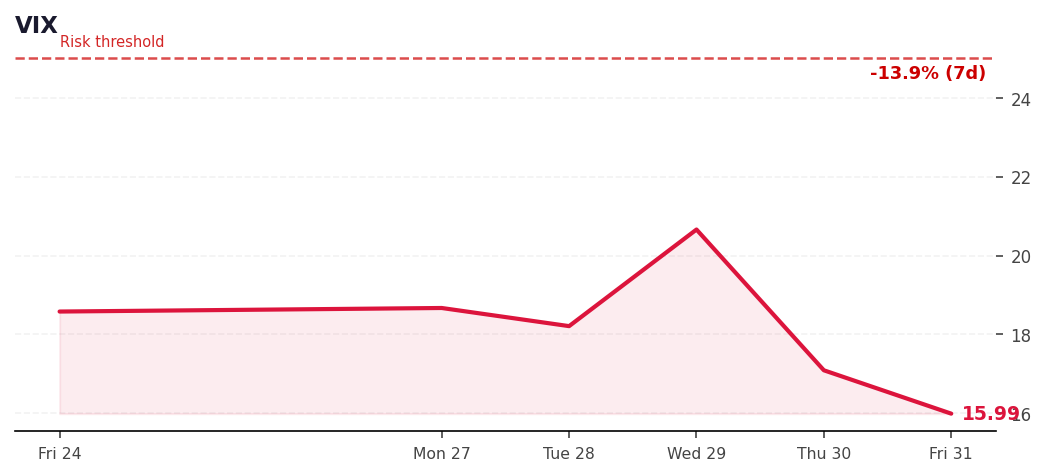
VIX · 15.99 · -13.94%
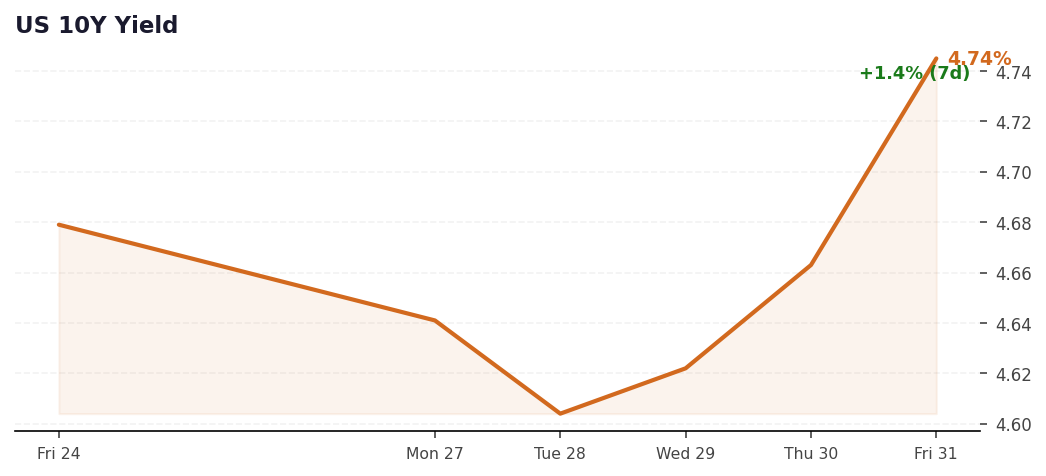
US 10Y Yield · 4.74% · +1.41%
Dollar Index · 99.69 · -1.79%
Brent Crude · 90.12 · -6.88%
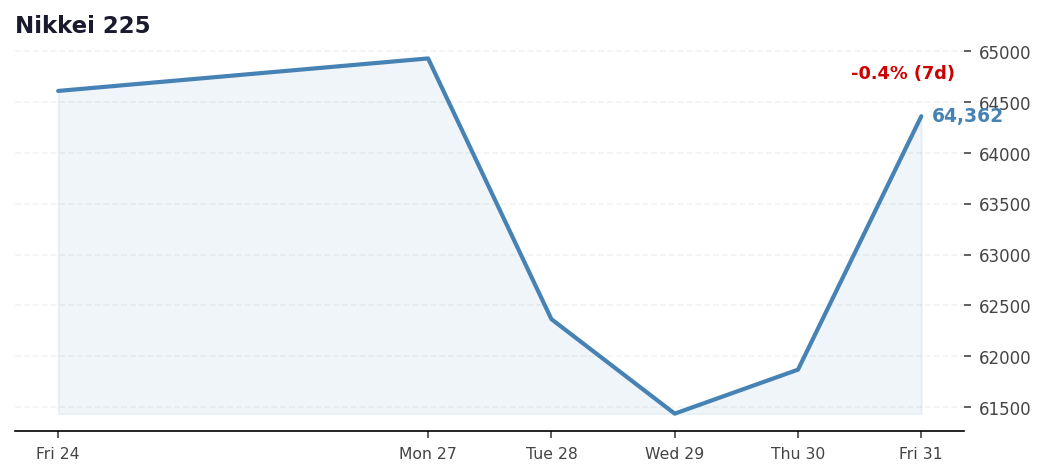
Nikkei 225 · 63,706 · -1.89%
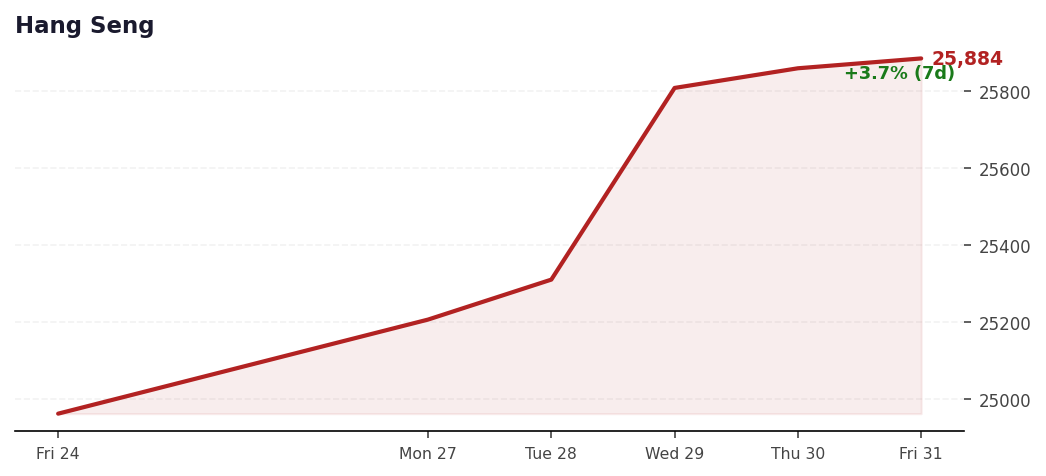
Hang Seng · 25,905 · +2.77%
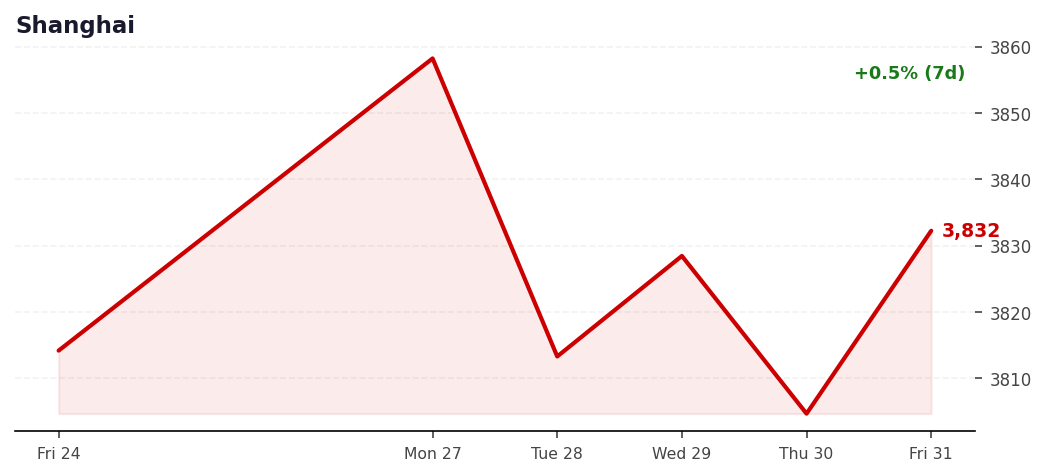
Shanghai · 3,799 · -1.54%
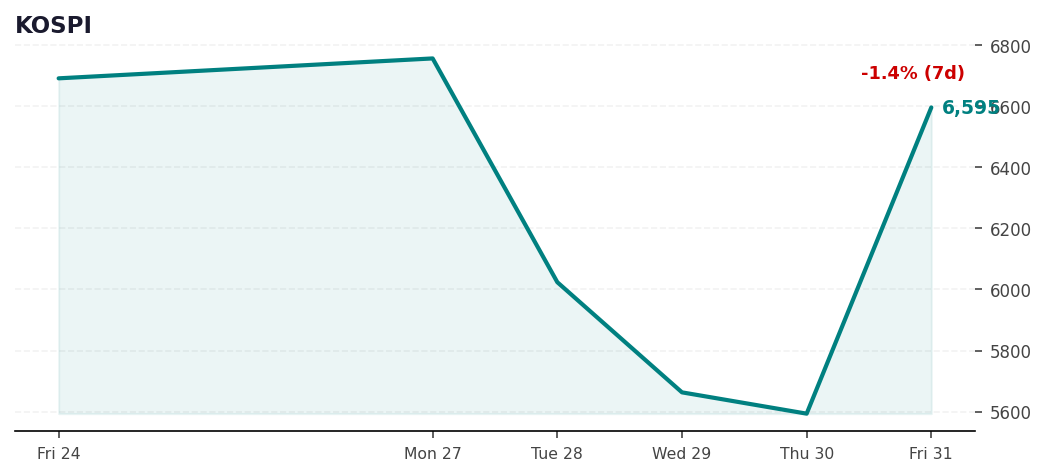
KOSPI · 6,225 · -7.86%
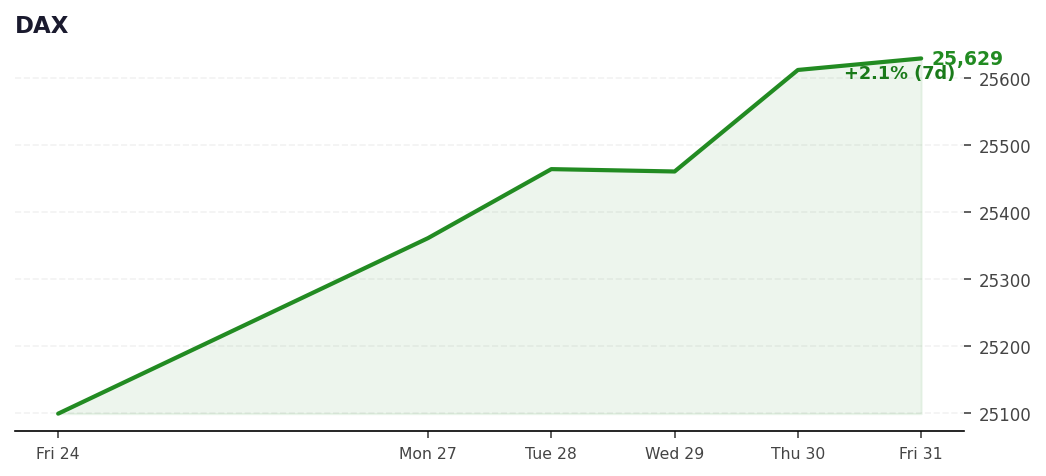
DAX · 25,629 · +2.11%
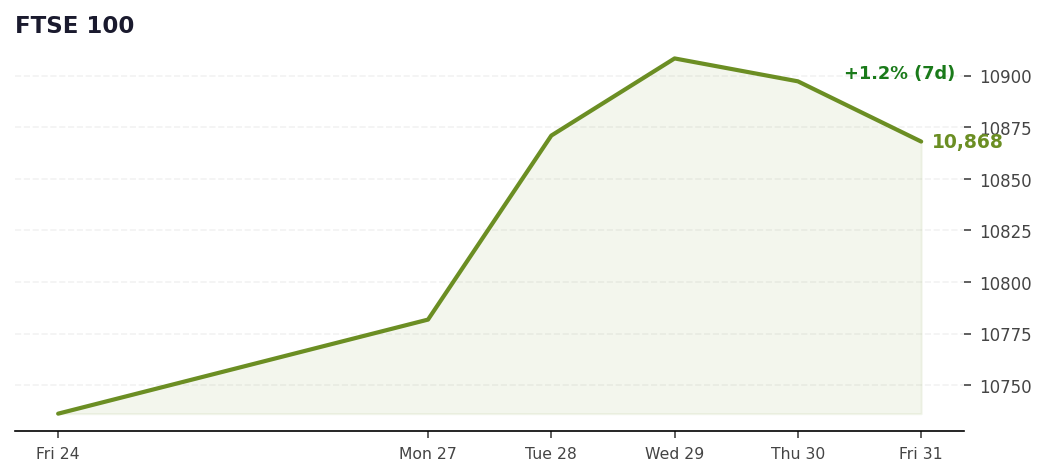
FTSE 100 · 10,868 · +1.23%
Global Macro Pulse
Indicator
Last Value
7d Change
Signal for India
VIX
15.99
-13.94%
Neutral
US 10Y
4.74%
+1.41%
Headwind
DXY
99.69
-1.79%
INR relief
Brent
90.12
-6.88%
CAD stress
S&P 500
7,490
+1.05%
Risk-ON
Hang Seng
25,905
+2.77%
EM rotation risk
7. Sector Performance Snapshot
Sector Index
Close
5d
vs SMA50
vs SMA200
Regime Signal
As of
Nifty Pharma
26,662.8
+1.10%
+6.04%
+14.50%
Above both MAs
03-08-2026
Nifty Metal
12,914.5
gap
-0.23%
+10.59%
Cooling — above SMA200
03-08-2026
Nifty Realty
913.0
gap
+11.43%
+9.36%
Above both MAs
03-08-2026
Nifty Consumer
40,072.2
+2.41%
+8.13%
+8.66%
Above both MAs
31-07-2026
Nifty Media
1,568.7
gap
+6.71%
+8.45%
Above both MAs
03-08-2026
Nifty Auto
28,744.2
+3.94%
+7.40%
+6.90%
Above both MAs
31-07-2026
Nifty Energy
38,937.0
gap
-2.14%
+5.22%
Cooling — above SMA200
03-08-2026
Nifty Bank
58,247.9
+1.82%
+2.67%
+1.38%
Above both MAs
03-08-2026
Nifty Infra
9,409.2
+1.16%
+0.61%
+0.62%
Above both MAs
31-07-2026
Nifty PSU Bank
8,486.7
gap
+1.92%
+0.13%
Above both MAs
03-08-2026
Nifty Finance
26,594.0
+1.79%
+1.74%
-0.48%
Recovering — below SMA200
31-07-2026
Nifty IT
31,715.2
+1.90%
+10.89%
-3.21%
Recovering — below SMA200
03-08-2026
Nifty FMCG
49,965.6
gap
+1.01%
-3.59%
Recovering — below SMA200
03-08-2026
8. Key Fundamentals — Nifty50 Leaders & Laggards
Symbol
EPS (Rs)
EPS YoY%
Period
Notes
JSWSTEEL
19.02
+112.99%
Jun 2026
Metal cycle turn; biggest EPS delta in the index, sector +10.05% vs SMA200
ONGC
8.60
+45.52%
Mar 2026
Crude-linked — the same Brent fall that helps the CAD cuts upstream realisations
ASIANPAINT
16.05
+39.93%
Jun 2026
Input costs flipped from headwind to tailwind as crude fell; CAN SLIM candidate
APOLLOHOSP
36.81
+35.83%
Mar 2026
Healthcare demand steady; >25% EPS growth, third straight strong quarter
M&M
43.86
+33.56%
Jun 2026
Auto is the leading sector (+6.90% vs SMA200); CAN SLIM candidate on >25% growth
BAJFINANCE
9.61
+27.12%
Jun 2026
Swung from -6.85% to +27.12% in two quarters — NBFC margin pressure easing
COALINDIA
14.36
+0.63%
Jun 2026
Flat at +0.63%; energy transition drag persists
HINDUNILVR
11.38
-2.98%
Jun 2026
FMCG is -3.89% vs SMA200 and lagging a risk-ON tape; no catalyst
SBIN
21.28
-3.10%
Mar 2026
PSU Bank only +0.56% over its 200-day; earnings not yet supporting a re-rating
MARUTI
109.63
-9.11%
Jun 2026
Contracting while its own sector leads — the laggard inside the strongest index
RELIANCE
15.48
-22.41%
Jun 2026
Heaviest index weight, EPS -22.41% — the single biggest drag on a Nifty reclaim
DRREDDY
5.32
-68.69%
Jun 2026
Weakest EPS in the index against a sector trading +14.44% over its 200-day
The fundamentals are current again.screener_cache/ was refreshed on 02-08-2026
and now carries Jun 2026 quarters for most names — yesterday's report was working from Dec 2025
and understated the picture badly. Two things stand out on the fresh data. ASIANPAINT has gone from -4.58%
to +39.93% and BAJFINANCE from -6.85% to +27.12%: falling input costs and easing funding
pressure are showing up in earnings, not just in price. Against that, RELIANCE is at -22.41%. It is
the heaviest weight in the index, and the Nifty is trying to reclaim its 200-day with its largest constituent
contracting earnings by a fifth. That is the strongest argument for why this reclaim could still fail.
Periods are mixed (Jun 2026 for most, Mar 2026 for ONGC, APOLLOHOSP and SBIN) because filing dates differ
— compare within a row, not across them.
9. Scan Results — Money Maker (STABLE regime)
Symbol
Date
Close
Entry
SL
Risk%
VolSpike
DaysBelow
MaxDepth%
Status
No signals today.
Why zero: this is a gate rejection, not an absence of setups. Fifteen Nifty500 names produced a
valid V3 shaved-bottom candle in the last ten sessions and every one was rejected by the V4/V5 market
filter, which requires the Nifty to close above its 200-day. The index closed 1.60% below that line on
31-Jul and has been under it for 103 of the last 120 sessions. Nifty50 (V5 filters) produced no raw
candles at all. The blocked candles, newest first:
Symbol
Candle Date
Close
Vol vs 100d avg
Blocked by
ASHOKLEY
31-07-2026
166.18
1.89x
Index SMA200 gate
HYUNDAI
31-07-2026
2,180.70
4.73x
Index SMA200 gate
BALKRISIND
30-07-2026
2,306.90
19.86x
Index gate + vol spike >2.5x
HEROMOTOCO
30-07-2026
5,325.00
2.15x
Index SMA200 gate
LTFOODS
30-07-2026
397.10
10.44x
Index gate + vol spike >2.5x
SAGILITY
30-07-2026
45.98
2.47x
Index SMA200 gate
AFFLE
28-07-2026
1,631.80
12.68x
Index gate + vol spike >2.5x
HEXT
28-07-2026
593.15
10.17x
Index gate + vol spike >2.5x
IEX
28-07-2026
132.11
2.62x
Index gate + vol spike >2.5x
CONCOR
27-07-2026
510.50
7.09x
Index gate + vol spike >2.5x
PVRINOX
24-07-2026
1,063.95
5.56x
Index gate + vol spike >2.5x
INDIACEM
21-07-2026
405.20
1.99x
Index SMA200 gate
JKCEMENT
21-07-2026
5,658.00
3.76x
Index gate + vol spike >2.5x
INDIANB
20-07-2026
858.50
1.65x
Index SMA200 gate
OIL
20-07-2026
453.55
1.73x
Index SMA200 gate
Note the volume column: nine of the fifteen printed spikes above 2.5x,
which the V5 cap treats as panic rather than accumulation. Rockets average 1.74x. On that measure ASHOKLEY
(1.89x), INDIANB (1.65x), OIL (1.73x) and INDIACEM (1.99x) have the cleanest volume profiles of the group.
10. Sector Recommendation
Sector
Recommendation
Rationale
Auto
OVERWEIGHT
Above both MAs: +7.40% vs SMA50, +6.90% vs SMA200 — strongest cyclical, and cyclicals lead out of a bottom.
Consumer
OVERWEIGHT
Above both MAs: +8.13% vs SMA50, +8.66% vs SMA200 — best combined reading in the sector table.
Pharma
OVERWEIGHT
+5.98% vs SMA50 and +14.44% vs SMA200 — the largest 200-day premium of any sector.
Realty
WATCHLIST
+10.58% vs SMA50 and +8.51% vs SMA200, but -1.39% on the week and the series has a two-week data gap.
Metal
WATCHLIST
+10.05% vs SMA200 but -0.71% under its 50-day — long-term strong, short-term stalling.
Media
WATCHLIST
+9.91% vs SMA200 on a gapped series, and -1.78% today; thin and illiquid — size accordingly if at all.
Banks
NEUTRAL
+1.90% / +0.60% — has just crossed above both MAs but by a rounding error; tracks the index.
PSU Bank
NEUTRAL
+2.35% / +0.56% — same marginal reclaim as Banks, with more rate sensitivity.
Infra
NEUTRAL
+0.61% / +0.62% — above both averages by the thinnest margin in the table; no edge.
Finance
NEUTRAL
+1.74% vs SMA50 but -0.48% vs SMA200 — still short of a reclaim.
FMCG
UNDERWEIGHT
+0.69% vs SMA50 and -3.89% vs SMA200 — defensive, no catalyst, and lagging a risk-ON tape.
IT
UNDERWEIGHT
+10.89% vs SMA50 but -3.21% vs SMA200 — a bounce inside a downtrend.
Energy
AVOID
-2.31% under its 50-day with Brent parked on $90.12; the CAD-stress line has not been cleared.
11. Long-Term Watchlist
Grade-A rocket profiles inside the 10% risk cap, from
watchlist.csv (regenerated today on settled 31-Jul closes). All meet every Money Maker
precondition except the trigger candle. Gap to SMA200 is measured on the 31-Jul close.
Symbol
Why Watch
Risk%
Gap to SMA200
Trigger to Act
COLPALINDIA
Dip 1d / 0.2% deep — rocket profile
6.8%
-0.2%
Close > 2,080.86 on volume >1.5x
BHARTIHEXAINDIA
Dip 1d / 0.3% deep — rocket profile
6.9%
-0.3%
Close > 1,611.92 on volume >1.5x
URBANCOINDIA
Dip 1d / 0.6% deep — rocket profile
6.1%
-0.6%
Close > 130.15 on volume >1.5x
JKCEMENTINDIA
Dip 1d / 1.8% deep — rocket profile
8.2%
-1.8%
Close > 5,541.21 on volume >1.5x
INDIANBINDIA
Dip 8d / 1.9% deep — rocket profile
7.4%
-0.8%
Close > 843.31 on volume >1.5x
SARDAENINDIA
Dip 2d / 2.2% deep — rocket profile
7.9%
-1.2%
Close > 522.90 on volume >1.5x
CDSLINDIA
Dip 9d / 3.3% deep — rocket profile
6.8%
-2.1%
Close > 1,361.58 on volume >1.5x
RITESINDIA
Dip 12d / 3.6% deep — rocket profile
7.1%
-2.8%
Close > 220.27 on volume >1.5x
Where each name actually closed — 03 Aug, and why none of them is a signal
The stock CSVs in this repo end at 31-Jul, so the 03-Aug bars below were
pulled directly from the daily feed and the full V3 signal test was re-run on each. Four names reclaimed
their own 200-day. Zero produced a valid signal. The reason is the volume column: the strategy requires
turnover above 1.5x the 100-day average, and the rocket cohort in this project's research averages 1.74x.
Today's reclaims happened on a quarter to a half of normal volume. That is a drift, not an accumulation.
Symbol
03-Aug Close
Day %
SMA200
vs SMA200
Volume vs 100d
Verdict
BHARTIHEXA
1,645.80
+2.38%
1,611.46
+2.13%
0.36x
Reclaimed, inside the 5% band — fails volume. Best-placed name on the list.
JKCEMENT
5,563.50
+2.20%
5,535.52
+0.51%
0.49x
Reclaimed, shaved bottom, inside the band — fails volume.
INDIANB
845.00
+1.02%
843.78
+0.14%
0.53x
Reclaimed by a whisker — fails volume and wick.
URBANCO
146.19
+12.98%
130.13
+12.34%
12.09x
Fails the 5% band — a news spike that ran 12% clear of its line. Real volume, wrong setup.
COLPAL
2,077.00
+0.04%
2,080.48
-0.17%
1.15x
Still below the line. Closest of the laggards.
RITES
219.31
+2.44%
220.14
-0.38%
0.27x
Below, on almost no volume.
SARDAEN
516.20
-0.08%
522.77
-1.26%
1.12x
Red candle — disqualified on day one of the test.
EIHOTEL
330.10
+0.95%
336.04
-1.77%
0.15x
Below; the thinnest volume in the group.
CDSL
1,322.20
-0.81%
1,360.23
-2.80%
1.40x
Fell on an up day and moved away from its trigger — drop it down the list.
VOLTAS
1,324.80
-0.31%
1,367.27
-3.11%
0.24x
Below, red, no volume — laggard of the group.
Read this table as the answer to "can I buy something today?" The honest answer is no, and
the index gate is the second reason. The first is that on a day the Nifty rose 1.60%, not one staged
name attracted institutional turnover. Two names — BHARTIHEXA and JKCEMENT — are now above their
line and inside the 5% band, which means they need exactly one thing: a green shaved-bottom candle on
>1.5x volume while the index holds above 24,778. That is a live, specific, checkable trigger for
tomorrow. It is not a reason to act tonight.
Watchlist change — retire POLYCAB. It has been carried as a reclaim candidate
waiting on roughly Rs 7,279. That is long gone: POLYCAB closed 31-Jul at 9,106.50, which is
+12.25% above its 200-day (8,112.85) and 3.5% below its 50-day (9,432.13). It fails the Money
Maker precondition that price sit within 5% of the SMA200 from below, and it is no longer above its 50-day.
The reclaim it was being watched for has already happened and the move has run. Remove it from the
reclaim watchlist; if you want the name, it is a different trade requiring a different thesis.
12. What to Avoid — High Conviction
NIFTY IT — +10.89% over its 50-day but still -3.21% under its 200-day — a bounce inside a downtrend, which is the classic STABLE-regime trap.
ENERGY / OMCs — Brent fell 6.88% on the week and stopped dead at $90.12 — exactly the CAD-stress line — and the sector is -2.31% under its own 50-day. Relief that halts at the threshold is not relief.
Any blocked Money Maker signal — 15 Nifty500 names fired valid V3 candles and were rejected by the index gate — taking them manually discards the single filter that drives the strategy's edge.
Front-running the index gate — Nifty closed 3.80 points below its 200-day. Three points feels like a rounding error and it is not — buying the watchlist before a close clears 24,778 is taking the trade without the filter that produces the edge, dressed up as anticipation.
Any reclaim on sub-1x volume — BHARTIHEXA reclaimed on 0.36x its 100-day average, JKCEMENT on 0.49x, INDIANB on 0.53x. The rocket cohort averages 1.74x — a reclaim institutions did not pay up for is the profile that fails, whatever the index does.
ASHOKLEY and HYUNDAI — The two most recent blocked candles (31-Jul, 1.89x and 4.73x volume) but indicative risk of 10.2% and 14.8% — both fail the 10% cap even if the gate opens tomorrow.
RELIANCE as an index-reclaim proxy — EPS -22.41% on the fresh Jun-2026 quarter — buying the heaviest index weight to play a Nifty breakout means buying the biggest thing dragging on it.
WDAY (US) — Indicative risk 25.5% of entry — two and a half times the 10% cap; position size collapses to noise.
ECLERX / SAGILITY / KFINTECH — Textbook dip profiles (0.4-3.7% depth) but risk of 15.8-16.8% at current ATR — the setup is right and the volatility makes it untradeable.
SUNDARMFIN — 18 days below its 200-day with 7.4% depth — the loser profile (avg 50 days, 7.9% depth) rather than the rocket profile (19.5 days, 4.1%).
POLYCAB as a Money Maker candidate — It already reclaimed: +12.25% over its 200-day and now -3.5% under its 50-day. It fails the 'within 5% of SMA200' precondition outright — retire it from the reclaim watchlist.
13. Strategist's Commentary
P — POSITIONYesterday I said one thing: the day Nifty50 closes above its 200-day, I deploy. Today it closed at 24,774.30 against a 200-day of 24,778.10. Three points and eight-tenths. The call was right in direction and it is still, by the letter of the rule, unconfirmed — and I am going to hold that line, because a filter you override when it is inconvenient is not a filter. The index rose 1.60% and finished at the high of the session, which tells you there was no selling into the close. It has spent 103 of the last 120 sessions below that line. A nine-month downtrend does not end with a bang; it ends with the index grinding up to the line, closing four points short, and making everybody who has waited this long feel foolish for one more night. That is exactly where we are. Nothing has been given back and nothing has been earned.
A — ANALYSISThe chain starts with the dollar and the barrel moving down together. Brent is off 6.88% over seven days, the dollar index 1.79% to 99.69, VIX 13.9% to 15.99, and the rupee has firmed from 95.68 on Thursday to 95.24. For India this is the rare case where every macro input moves the right way at once — cheaper crude repairs the current account, a softer dollar reopens EM flows, and a firmer rupee removes the translation drag on foreign allocators. Compare that to yesterday's picture, where a weak dollar was being cancelled out by a rising 10-year and India was visibly losing the EM rotation to Hong Kong. What has changed is that India is now participating rather than watching. But be honest about what is not in the evidence: there is no domestic catalyst anywhere in today's feed, and the 10-year is still 4.74% and still rising. This is a positioning move, not a repricing of India's fundamentals, and it can be unwound by a single firm US payrolls print — which is due this week and which the FT is already flagging as the rates swing factor. Two things the consensus is getting wrong. First, everyone is still calling IT the recovery trade — it is up 10.89% over its 50-day and the desks love it — but it is still 3.21% below its 200-day. That is a ferocious bounce inside a downtrend, which is the single most expensive mistake available in a STABLE regime. Second, and more usefully, nobody is talking about Auto and Consumer. Nifty Auto is +7.40% over its 50-day and +6.90% over its 200-day; Consumer is +8.13% and +8.66%. Both are above both averages — the actual definition of leadership — and both were reported as having no data yesterday. Leadership rotated into the cyclicals while the tape argued about IT, and the rocket-stock work in this project is unambiguous that cyclicals beat defensives out of a bottom. The one genuine hole in the bull case is Brent at $90.12. It fell hard and then stopped dead on the CAD-stress line. A 6.9% weekly fall that halts exactly at the threshold is not relief — it is a market that has run out of sellers at the level that matters to India. And now the thing almost nobody will check tonight: the volume. Four watchlist names reclaimed their 200-day today. BHARTIHEXA did it on 0.36x its 100-day average volume. JKCEMENT on 0.49x. INDIANB on 0.53x. The strategy requires 1.5x, and the reason is not arbitrary — the rocket cohort in this project's own research averages 1.74x, because a reclaim that matters is a reclaim institutions pay up for. What happened today was a thin, unopposed drift higher on an imported bid, in a holiday-quiet tape, with no domestic buyer of size anywhere in it. The index closing four points from the gate is the headline. The internals being this hollow is the story. I would rather see the Nifty fail here, come back on real volume, and give me a reclaim I can trust than take a breakout that half the market did not bother to participate in.
R — RECOMMENDATIONDo not buy anything in India today, and be entirely comfortable with that. The scan returned zero signals for the second session running, and that is the filter earning its keep — 15 Nifty500 names fired textbook V3 shaved-bottom candles in the last ten sessions, ASHOKLEY (1.89x volume) and HYUNDAI (4.73x) as recently as Friday, and the index gate rejected every one. The backtests are not ambiguous: taking those signals with the index below its 200-day is precisely how this strategy bleeds. And understand that the gate was not the binding constraint today — even had it been open, there was nothing to buy. Not one of the ten Grade-A names printed a valid signal candle. BHARTIHEXA, JKCEMENT and INDIANB reclaimed their 200-days but on 0.36x, 0.49x and 0.53x volume against a 1.5x requirement. COLPAL closed 0.17% below its line. CDSL fell 0.81% and is now 2.80% under. URBANCO jumped 12.98% on 12.09x volume and in doing so put itself 12.34% above its 200-day — outside the 5% entry band entirely, which is the rule quietly saving you from buying a news spike. What you do instead is get the orders written tonight, unfilled, on the two names that are now inside the band and above the line: BHARTIHEXA (1,645.80, 2.13% over its 200-day, risk 6.9%, 17 shares) and JKCEMENT (5,563.50, 0.51% over, risk 8.2%, 4 shares). Both need one more thing and only one: a green shaved-bottom candle on more than 1.5x volume, with the index above 24,778. Separately, if the gate opens, the three blocked signal names that clear the risk cap on their own numbers are CONCOR (trigger 530.50, SL 499.25, risk 5.9%, 64 shares), IEX (134.76 / 124.92, 7.3%, 203 shares) and HEROMOTOCO (5,394.70 / 4,964.62, 8.0%, 4 shares). ASHOKLEY at 10.2% and HYUNDAI at 14.8% are outside it — skip them however good the candle looked. On sectors: OVERWEIGHT Auto and Consumer — above both moving averages, +6.90% and +8.66% over their 200-days respectively, and cyclical leadership is the correct profile coming off a bottom. Stay OVERWEIGHT Pharma at +14.50% over its 200-day. UNDERWEIGHT IT regardless of what the bounce looks like: -3.21% versus the 200-day is a downtrend having a good fortnight. Keep energy at AVOID while Brent holds $90. On the US side the gate is open — SPY is above both averages — and GILD (risk 6.8%), AXP (7.3%) and COO (8.5%) remain the three cleanest setups inside the cap. That is where incremental capital goes this week, because that is the only market where the filter is letting you act.
A — ALERTOne close above 24,778 opens the gate — but I am not buying the reclaim, I am buying the first watchlist name that prints a green shaved-bottom candle on more than 1.5x volume with the index above that line, because today proved the index can get there on no volume at all and that is the version of this breakout that fails.
14. Data Availability Notes
Asset
Last Updated
Status
Nifty50 index
03-08-2026
Updated
Nifty50 (clean)
03-08-2026
Updated
USD/INR
03-08-2026
Updated
Gold
03-08-2026
Updated
Nifty Bank
03-08-2026
Updated
Nifty IT
03-08-2026
Updated
Nifty Pharma
03-08-2026
Updated
Nifty FMCG
03-08-2026
Updated
Nifty Metal
03-08-2026
Updated
Nifty Energy
03-08-2026
Updated
Nifty PSU Bank
03-08-2026
Updated
Nifty Realty
03-08-2026
Updated
Nifty Media
03-08-2026
Updated
Nifty Auto
31-07-2026
Updated
Nifty Consumer
31-07-2026
Updated
Nifty Finance
31-07-2026
Updated
Nifty Infra
31-07-2026
Updated
VIX
31-07-2026
Updated
US 10Y
31-07-2026
Updated
DXY
03-08-2026
Updated
Brent
31-07-2026
Updated
S&P 500
31-07-2026
Updated
NASDAQ
31-07-2026
Updated
Hang Seng
03-08-2026
Updated
Nikkei
03-08-2026
Updated
Shanghai
03-08-2026
Updated
KOSPI
03-08-2026
Updated
DAX
31-07-2026
Updated
FTSE 100
31-07-2026
Updated
Nifty50 constituents (nifty50_data/)
31-07-2026
Updated (53 symbols; no live 03-Aug bar)
Nifty500 constituents (nifty500_data/)
31-07-2026
Updated (534 symbols; no live 03-Aug bar)
S&P500 constituents (sp500_data/)
31-07-2026
Updated (515 symbols)
KOSPI
03-08-2026
Unreliable (series prints 6,756 → 5,594 → 6,595 → 6,225 in five sessions — implausible; excluded from the pulse read)